
 Pénzügyi szolgáltatás
- Pénzügyi szolgáltatás
Azure Charts
Live visual exploration environment for Azure Cloud and ecosystem.
Bemutatkozás
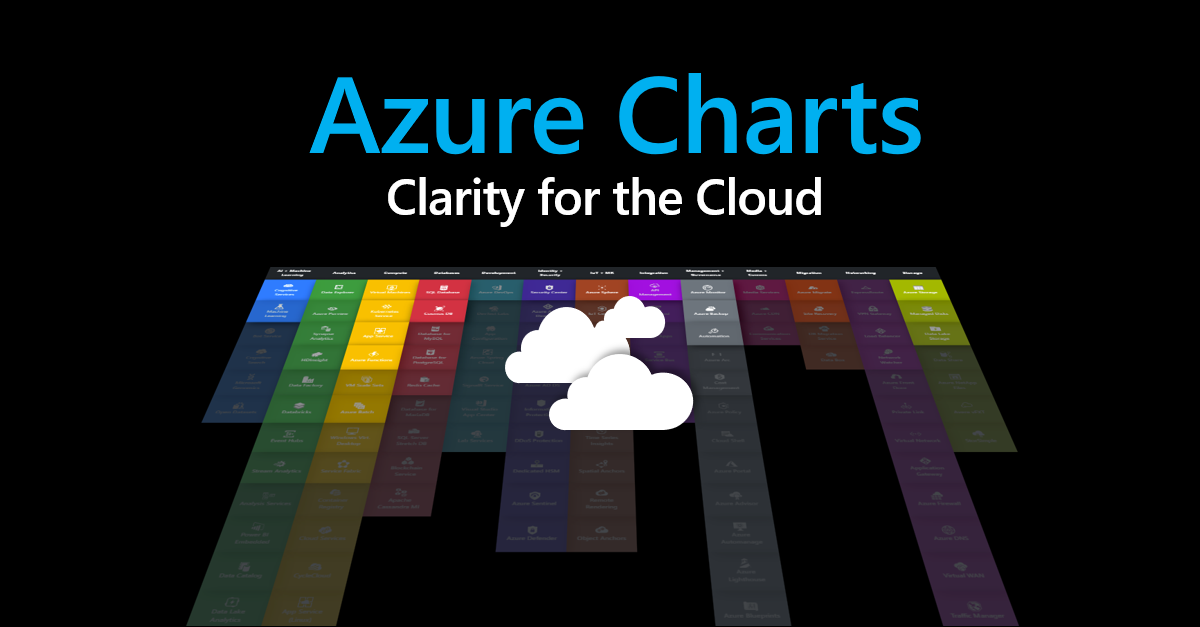
Azure Charts is a project developed by a Microsoft employee, offering a live visual exploration environment for Azure Cloud and its ecosystem. It communicates Azure's current state, structure, updates, and ecosystem in a compact, digestible way. The service is not officially backed by Microsoft and is maintained with low overhead through cloud automation. Azure Charts provides a wide range of services, including AI and machine learning, analytics, compute, databases, development tools, identity and security, IoT and mixed reality, integration, management and governance, media and communications, migration, networking, and storage.
Szolgáltatások, tevékenységek
- Azure Heat Map
- PoV Heat Maps
- Geo Heat Maps
- Queues + Sensors
- Update Queues
- Trend Sensors
- Geo Sensors
- Chart Flows
- NewsRoom Mode
- Auto NewsRoom
- Updates Feed + Export
- General Overview
- Services Overview
- Services PowerView
- Services + Capabilities
- AI + ML Overview
- VM Types Overview
- Cloud MacroState
- Summarization Mode
- SLA
- Lifecycle
- Forward Timelines
- Deprecations Board
- Backward Timelines
- Previews Board
- General Availability Board
- Past Deprecations Board
- Regions & Geos
- Region Scope
- Region Lookup
- Geo Scope
- Presence
- Presence Board
- Presence Heat Map
- Instance Types
- Reference Architectures
- Solution Explorer
- Solution Highlights
- QuickStart ARM & Bicep
- Template Explorer
- Template Highlights
- Case Studies & References
- Customer Story Explorer
- Evidence Map
- Evidence Highlights
- Modules, Paths, Videos
- Learning Explorer
- Learning Highlights
- Learning Top
- Study Map
- Associations
- Affinity Map
- Compliance Map
- Versatility Map
- AI-Powered Insights
- Historical Popularity
- Hybrid Value
- Enterprise Value
- Startup Value
- Sustainability Value
- Some Cloud Fun
- Azure Menu
- Azure Quiz
- Azure Night Sky
- Azure Festive Season